Quickstart: Build a Dashboard
This tutorial will walk you through how to start building a dashboard using Matico.
Make an account on our demo server or run Matico locally (see environment setup)
- Click the blue Login / SignUp button
- Create an account
- Log in, and navigate to the Apps page
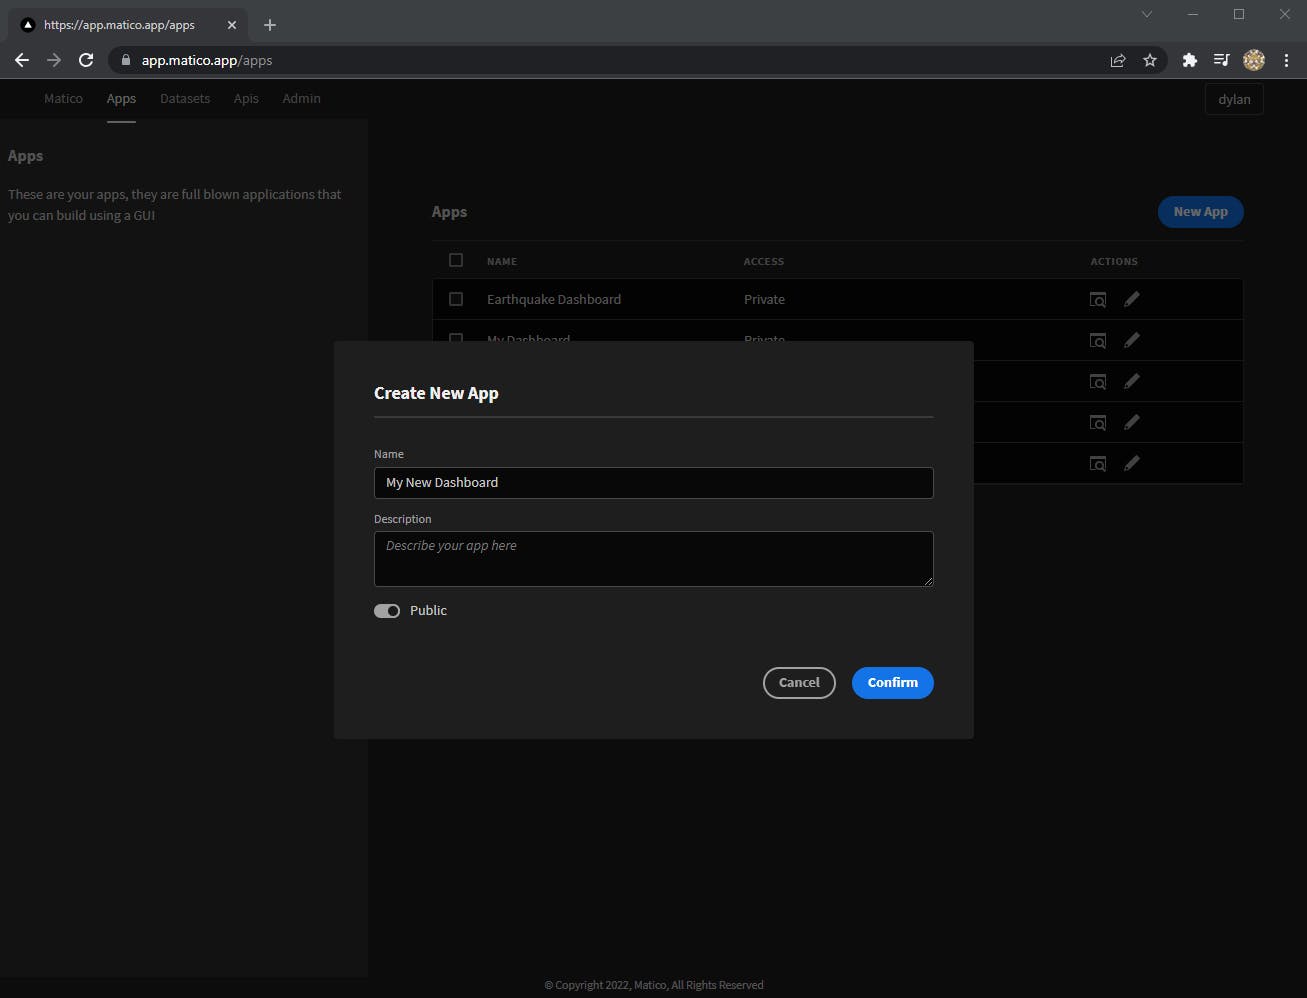
- Click the New App button, and give a name and description for your app
If you have data you'd like to work with, you can upload it to your Matico account. If you already have CSV (with lat/lon) or GeoJson data available online, you can add it directly as a dataset in your dashboard.
If not, we have some sample data ready to use. Copy this link for later.
Add a Dataset
- Click on the name of your new app in the list to start editing
- First, add a dataset by clicking on datasets in the top right and click add a dataset
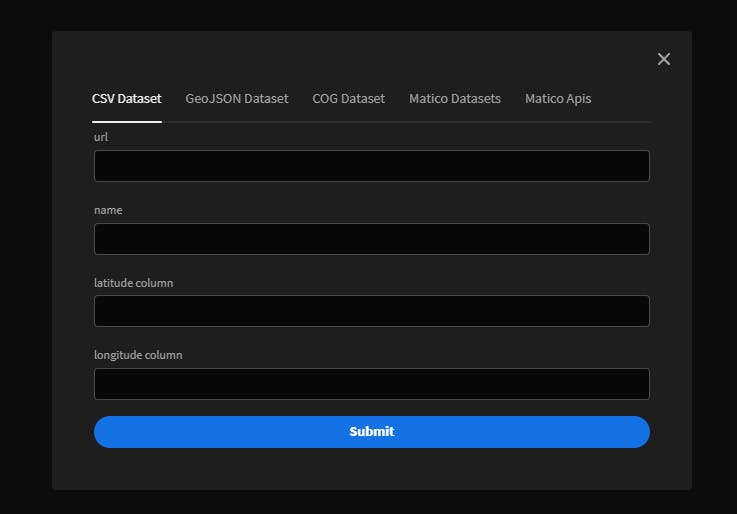
- If you have other Matico datasets or APIs, you can add them here.
- If you have online CSV or GeoJson data, you can also add them via a cross-origin accessible URL
- If not, grab the link from above for some sample county-level data from County Health Rankings and Roadmaps and enter it in the GeoJSON dataset tab, naming it "County_SDOH"
- After adding a dataset, you should see it appear in the datasets panel with a green indicator
Add a Page
- Next, click on the + sign on the vertical left hand bar to add a page
- You'll see a new page icon appear with a gear icon on the top right, which you can click to edit the page
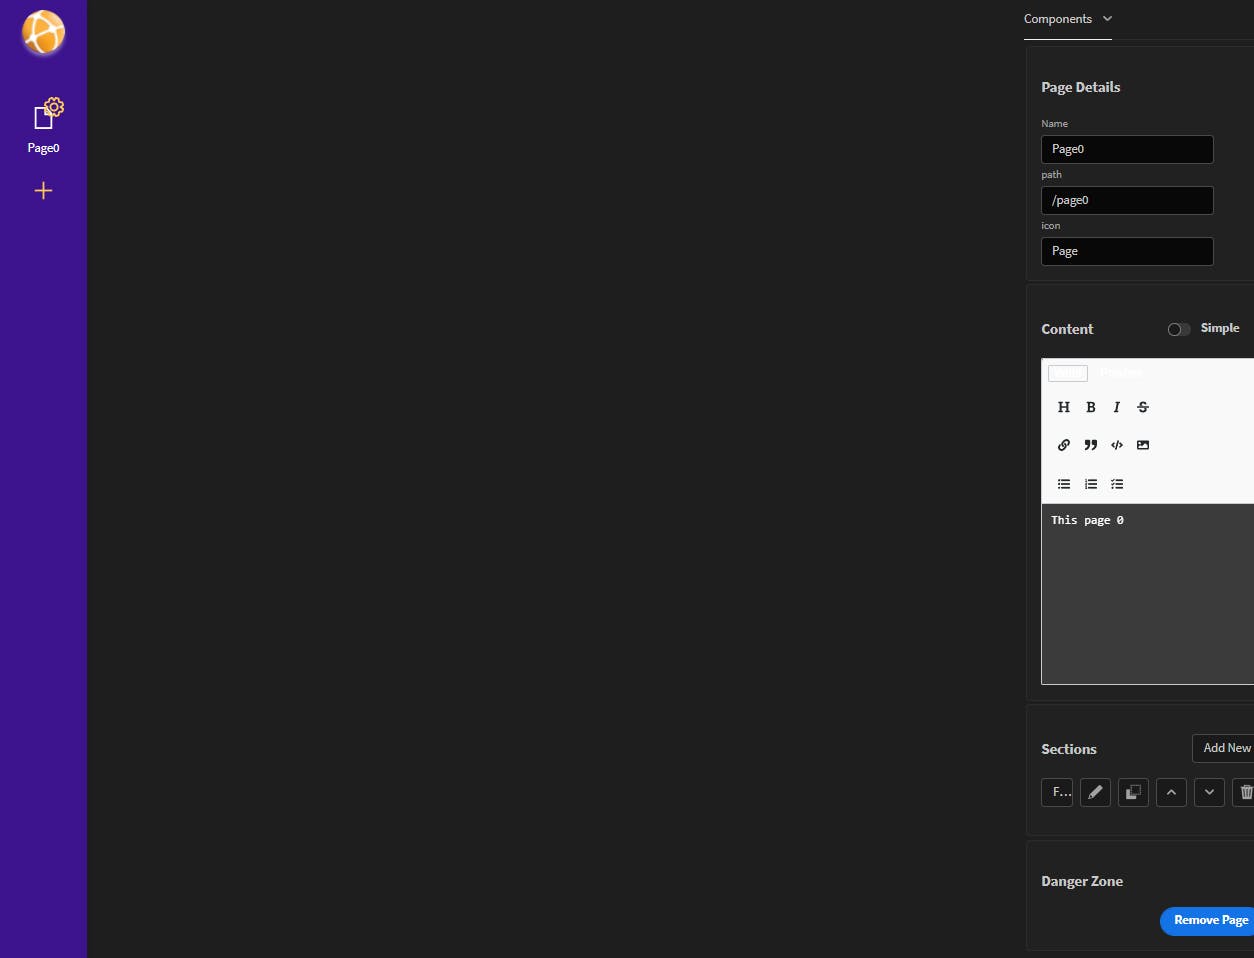
- Anywhere in the editor where you see the gear icon, you can click it to edit that page, section, or components
- On the right hand panel, got to Components if you aren't already, and you'll see settings for the page such as the name, URL path, and sections
- You can change the name and page of the page, or add multiple pages
Add a Section and Pane
- In the panel on the right, the Sections area contains the different sections of that page
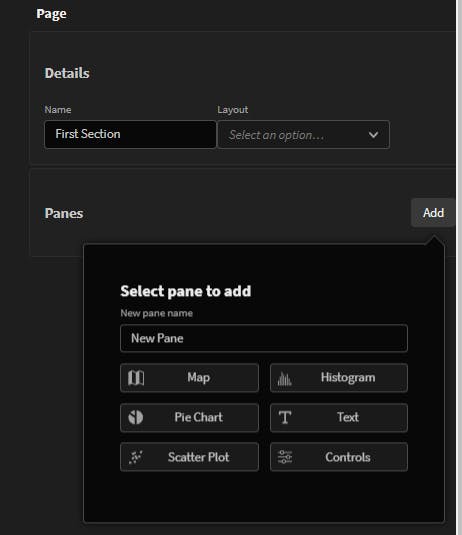
- Click on First Section to dive in
- Under that section, click the add button under Panes to start adding components
- Currently, you can add:
- Maps
- Histogram
- Pie Chart (WIP)
- Text
- Scatterplots
- Control Panels
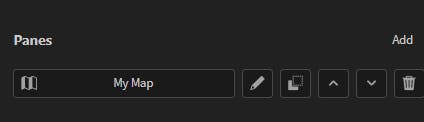
- Change the pane name to 'My Map' and then click on the Map Pane button
- Under Panes you should now see My Map available, with five buttons to the right
- Edit
- Duplicate
- Move Up and down
- Delete
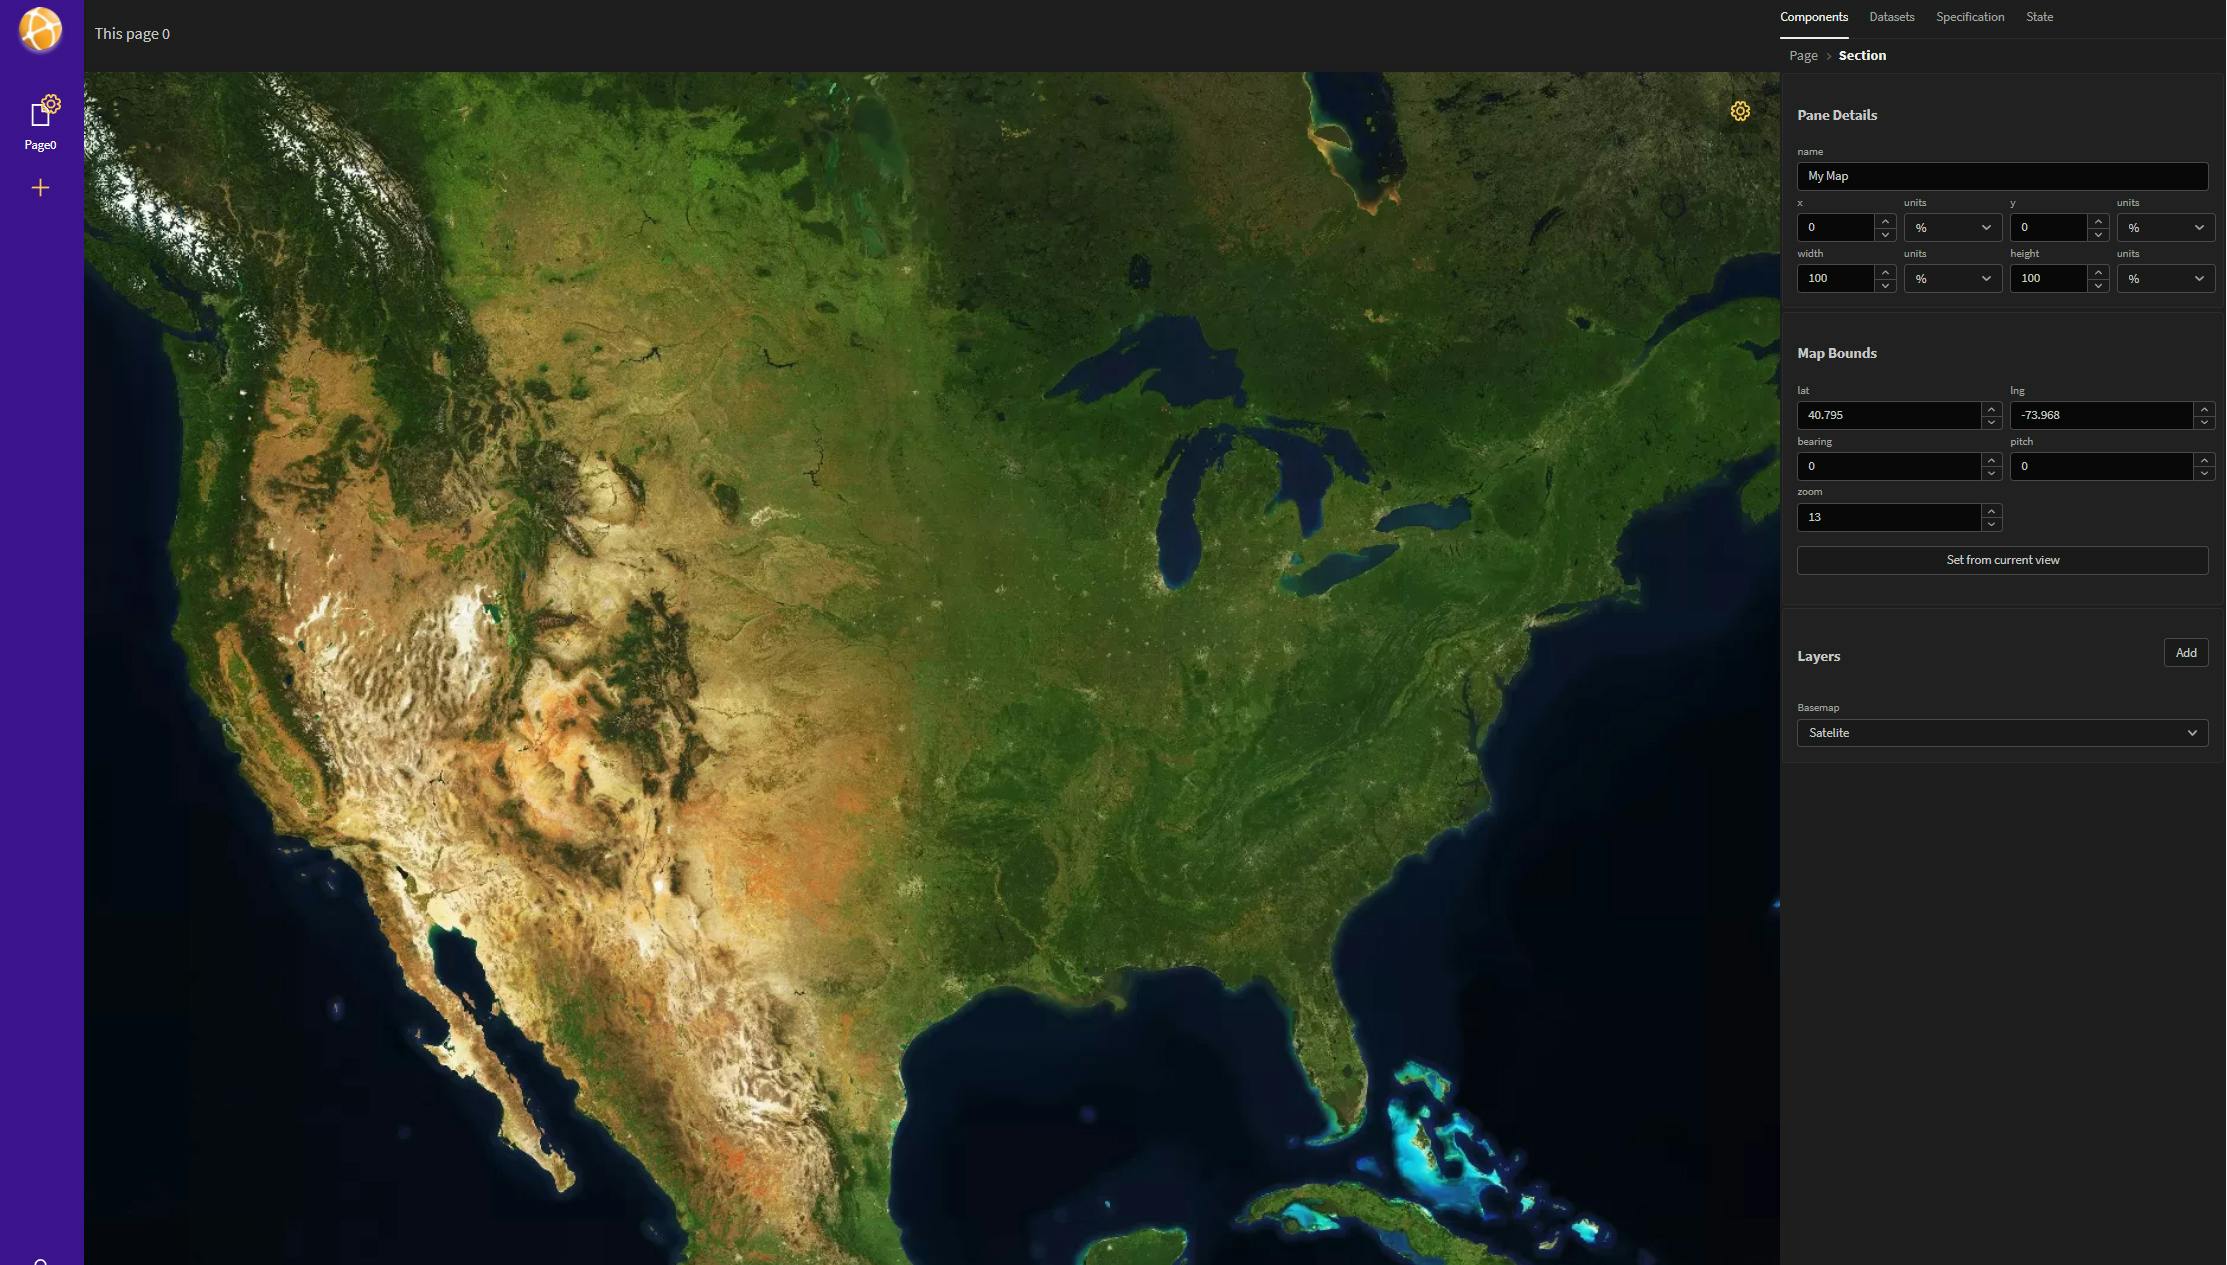
- Click on the Edit button to edit the pane, or click the gear on the map in the main area
- Each pane has its own set of controls, but in the Free layout you can set a percentage based dimension and location for each pane.
- You can choose to use pixel values if preferred, altough percentages will usually be better
Future layouts will support more traditional narrative format pages, as well as drag and drop grids.
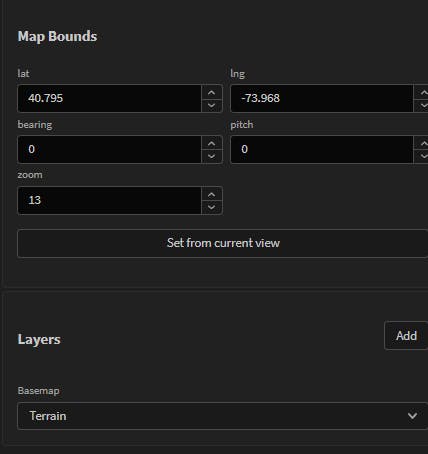
- On the edit controls for the map panel, you can also change the map center and zoom manually or from the current view you set on the interactive map
- At the bottom of the editing panel, you'll see an area to add map layers and change the basemap style
Add a Map Layer
- To add a map layer, click the Add button next to layer
- Name your layer, and select the dataset you'd like to use
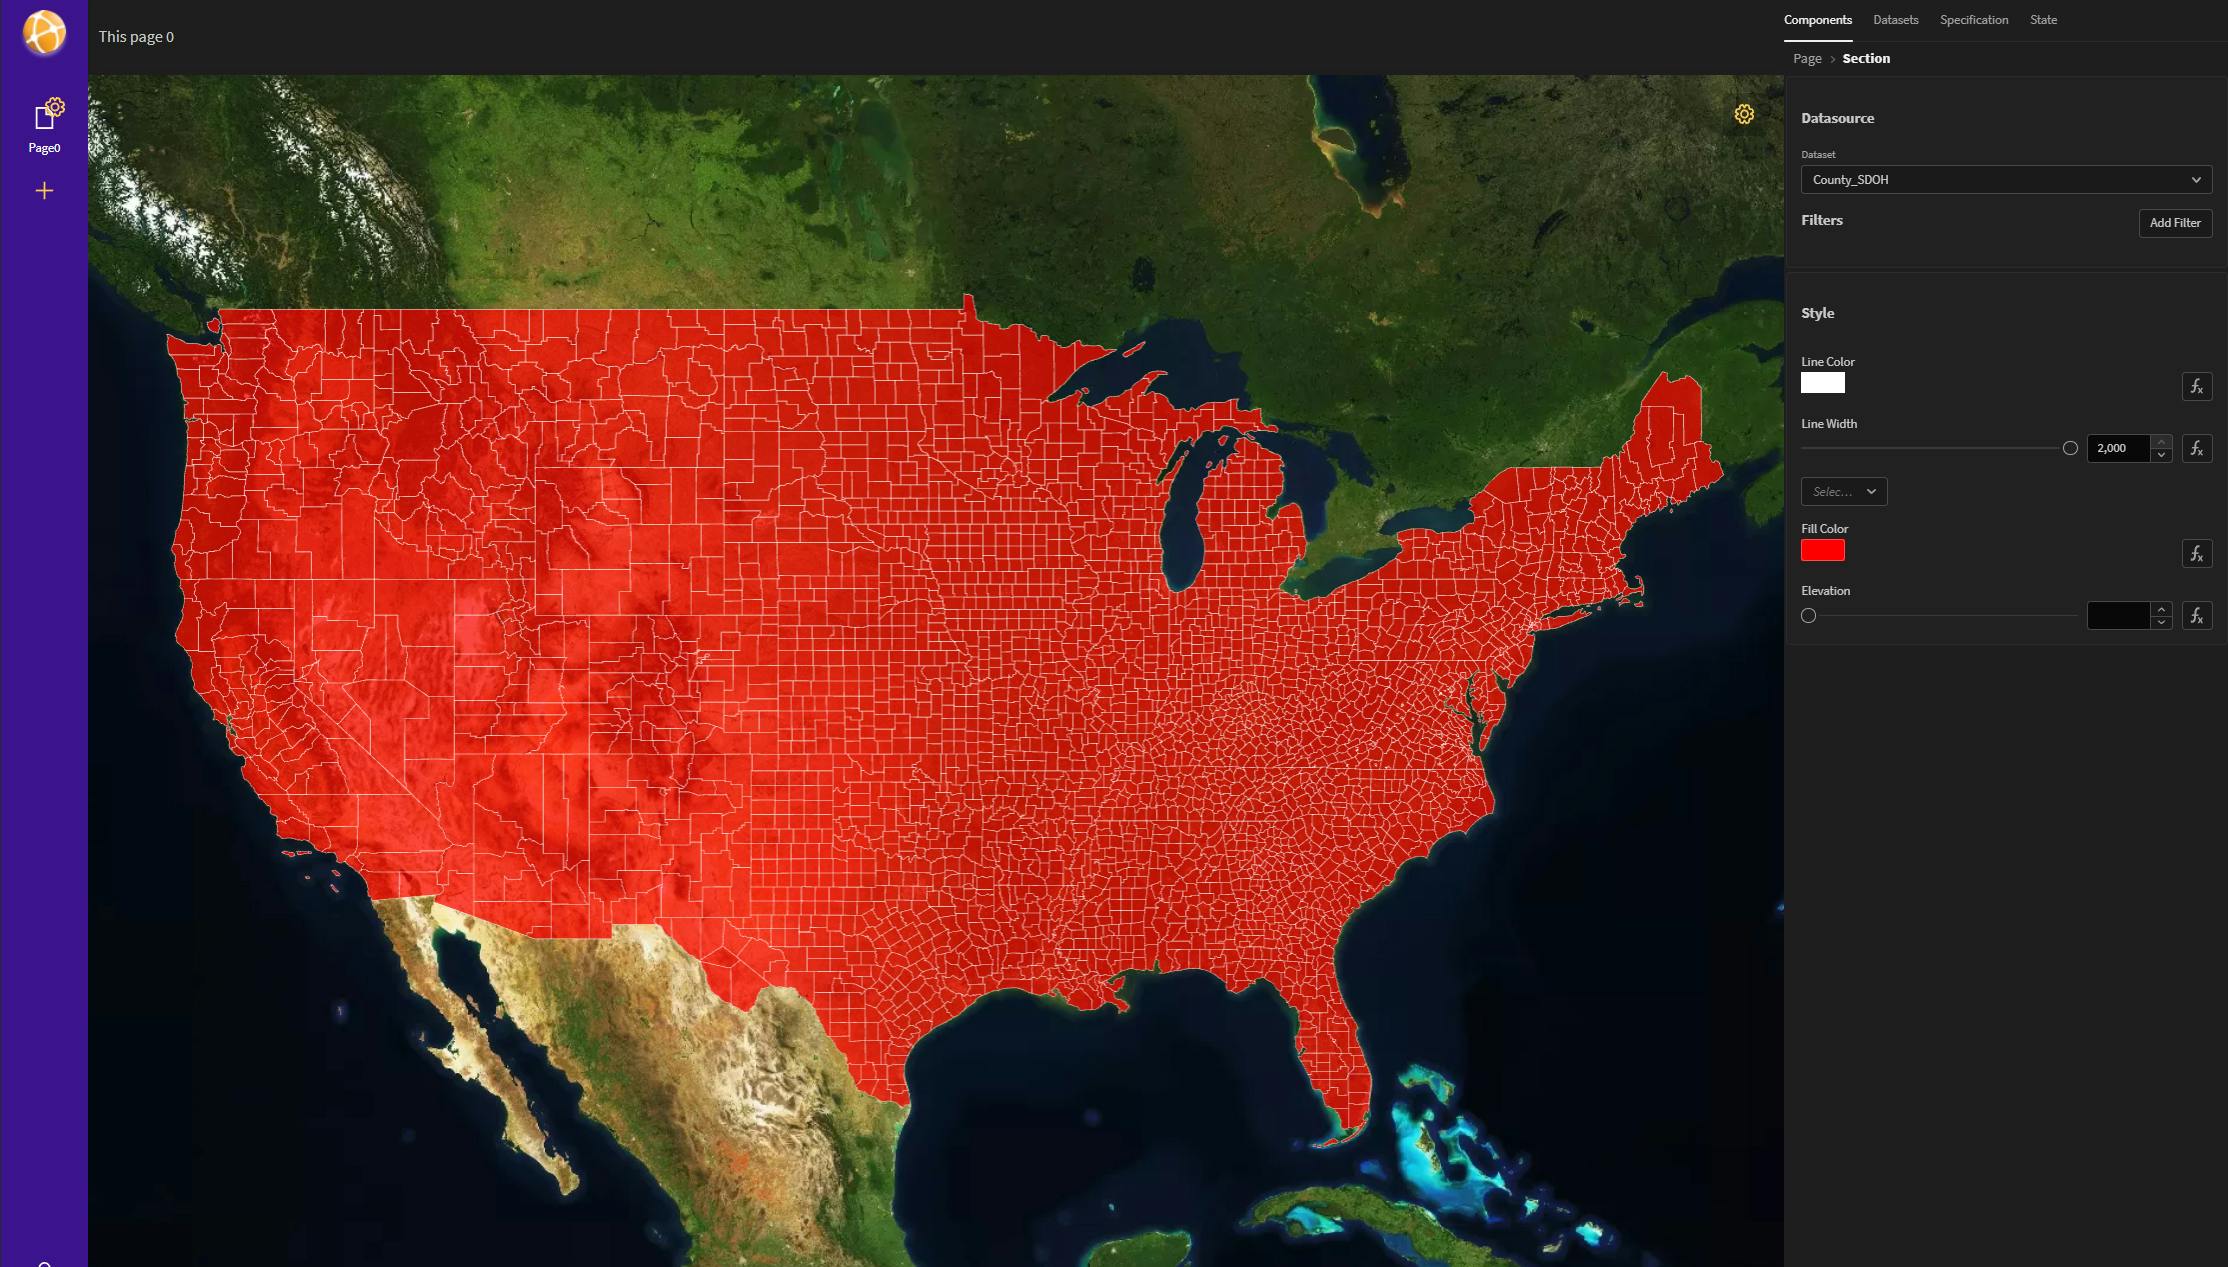
- Click on the layer that appears in the editor panel to start customizing your map layer
- You can change the line and fill colors using the color pickers, and change line width and 3d elevation with the slider
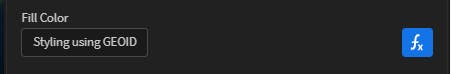
- To use data-driven styling, click on the fx button on the right side of the panel to enable quantitative styling
- Under fill color, click the fx button and then the button reading "Styling using variableName" (in this example "GEOID")
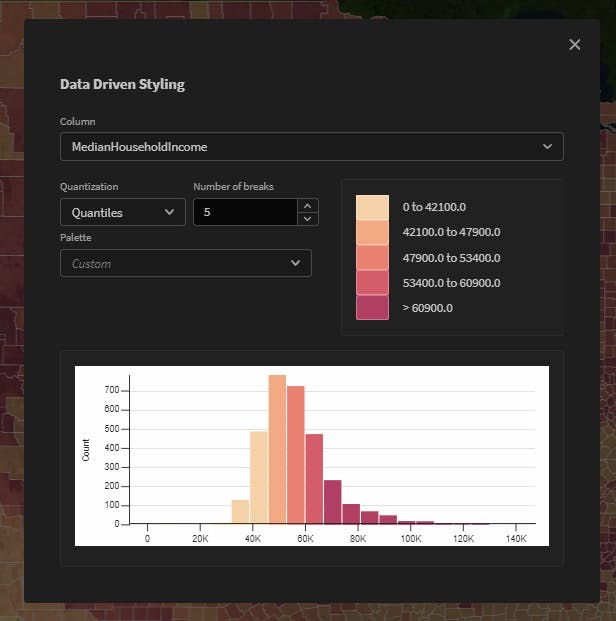
- In the data-driven styling panel, you can change the representation values of the fill or line color based on variable scaling, such as quantiles, continuous, or manual bins
- A histogram below shows the distribution and bins to preview how the data will be represented
- You can change then column, palette, and number of breaks to best suite your needs
You can follow these same steps to add charts, multiple maps, and mulitple pages to your dashboard. In the left panel, you can share the URL available under App Link to share your new dashboard!